A simple greeting can make a profound impact. When teachers take the time to greet their students with a smile at the classroom door, they are telling each student, “I care about you. I respect you. I value you.”
Feeling valued and connected can feed into a students’ sense of belonging at school. Belonging, in turn, correlates with greater student well-being and higher academic engagement. An intentional investment of attention on the adult’s part can have meaningful ripple effects for students.
Greeting students at the door is only one of many actions, big and small, that adults can take to help students in a school community feel a stronger sense of belonging. (Tweet this )
This guide provides a working definition of student sense of belonging and key research on the importance of student belonging. It also suggests tools, resources, and strategies at the classroom, school, and district levels to help you cultivate a school climate where students can feel they belong.
Jump to sections of this guide using the table of contents:
- What Is Student Sense of Belonging?
- Research on Students’ Sense of Belonging
- Activities to Create a Sense of Belonging in the Classroom
- Building Adult Capacity to Support Student Belonging
- How Can You Measure Student Sense of Belonging?
- Getting Intentional About Student Belonging
|
Key Takeaways:
|
Download Panorama's Student Survey
What Is Student Sense of Belonging?
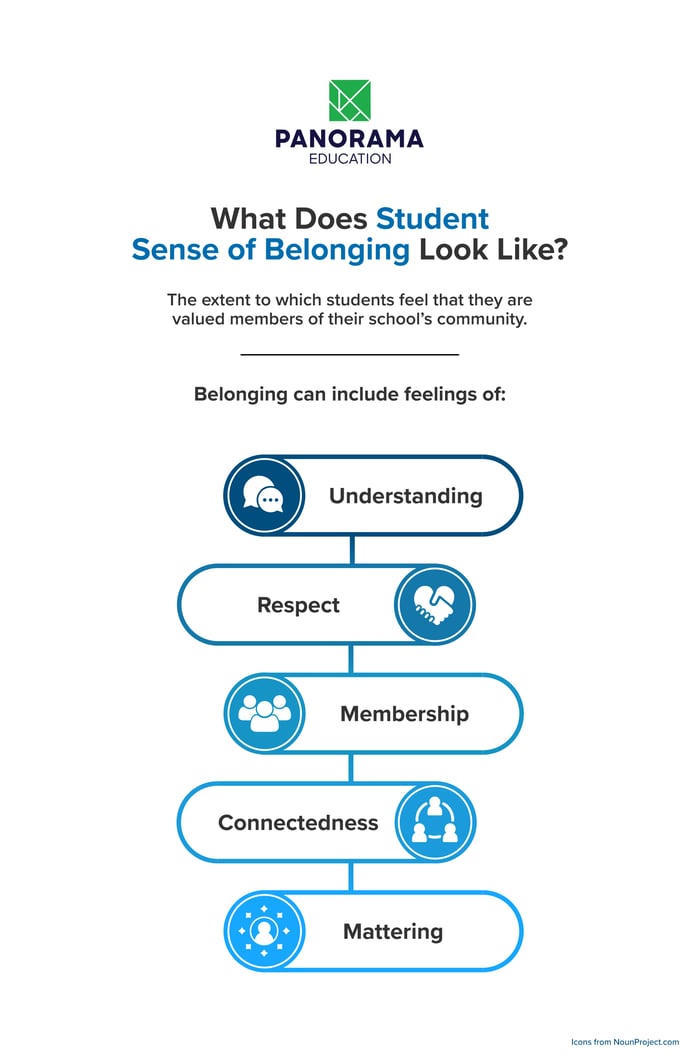
Our researchers at Panorama use a shared definition of belonging: the extent to which students feel that they are valued members of their school’s community. (Tweet this )
Belonging can include feelings of understanding, respect, connectedness, membership, or mattering. Sense of belonging is influenced by the classroom and school culture as well as by individual actions taken by adults in the school.
Take a moment to think about how important it feels to you to belong and have a sense of community membership in the places where you live, work, or play. Students care just as much about feeling like they belong at school.
|
|
Although we use a shared definition of belonging, we know that belonging can mean different things to different individuals and communities. Belonging might mean something a little different at your school or in your district.
Take a moment to consider:
- How do you define belonging?
- What are the characteristics of a feeling of belonging?
- What’s an example of when you feel you belong?
- How about an example of when you feel you don’t belong?
 Spread the word: save and share this image with your community!
Research on Students' Sense of Belonging
Humans are relational creatures and belonging is a fundamental human need. Researchers describe belonging as, "a major factor that contributes positively to an individual's psychological development."
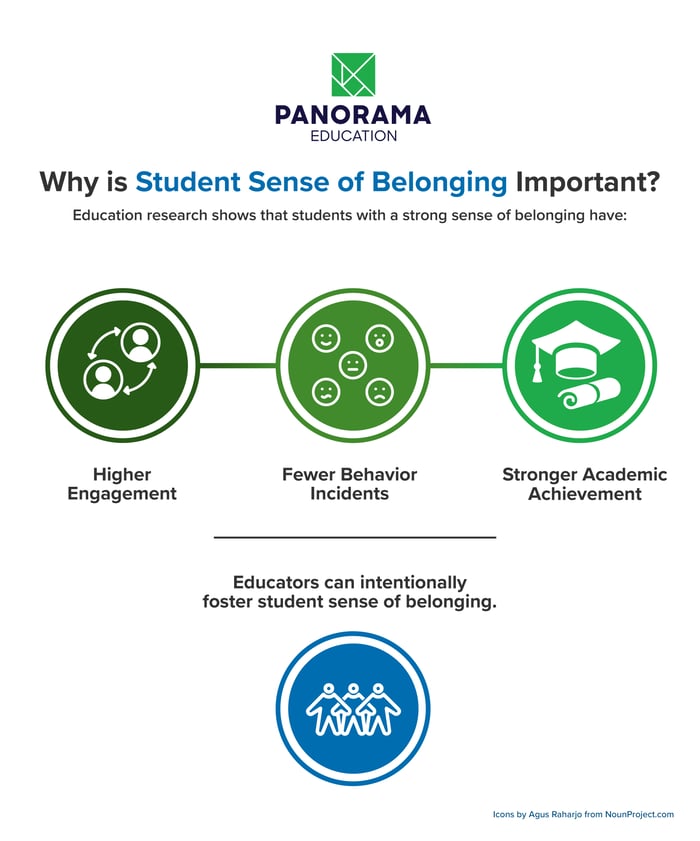
Beyond its implications for mental health, belonging plays a specific role in education. Research shows that belonging positively affects engagement, behavior, and academic performance. (Tweet this )
When learners feel that they belong in the educational setting:
- Student engagement increases
- Negative behavior incidences diminish
- Academic achievement improves
John Hattie’s Visible Learning research synthesized findings from 1,600+ meta-analyses of 95,000+ studies involving 300 million students. He found that teacher-student relationships, school climate, and sense of belonging all meaningfully contribute to accelerating academic success.
The evidence is clear: From primary school through middle school and high school, and even into higher education, it’s important to prioritize relationships and belonging to support student wellness and student success.
Spread the word: save and share this image with your community!
Activities To Create a Sense of Belonging in The Classroom
Many elements go into whether students feel they belong, such as whether the physical environment reflects their background or needs and their relationships with peers. Adults can also contribute to students' sense of belonging in the classroom by creating the conditions for belonging, safety, and trust.
One way to do that is through classroom practices and routines with students. (For system-level practices to create a culture of belonging, skip to the section below.)
Here are three activities adults can try in the classroom setting to foster a sense of belonging:
- “Get To Know You” User Guides
- Values Reflection
- Morning Meetings
1. “Get To Know You” User Guides
Students and adults can complete user guides and share them with their class (always to the extent they feel comfortable). A “user guide” is a document that can help individuals provide more visibility into their personalities, interests, and working habits, and facilitate more effective collaboration with peers and teachers.
Here are some questions to get started on what to include in a user guide:
- What makes you feel inspired?
- What is one thing you think you do well as a student?
- What do you like to do outside of school?
For more ideas, check out 101 Inclusive Get-to-Know-You Questions.
2. Values Reflection
The goal of Values Reflection is for students to consider their own belief systems and to celebrate—not to judge—the diversity of values, experiences, and beliefs in their classroom.
Teachers have students pick three to five core values that they hold. Students can reflect on these values by journaling using prompts, or express them by creating a mindmap or visual anchor of their values to share in pairs or small groups.
3. Morning Meetings
Morning meetings are a schoolwide classroom management practice used to address students’ social-emotional learning (SEL) needs on a daily basis throughout the school year. Setting aside time every day to check in and say hello builds a sense of belonging for students and adults in the classroom.
Every morning, teachers gather their students in a circle to interact with one another and kick-off the day. While these daily warm-ups will look different in different classrooms, they often include a greeting, time for personal sharing, SEL activity, and morning message.
Belonging Activities for Digital Classrooms
Online learning presents its own challenges for helping students build relationships and stay connected. With pandemic closures pushing many classrooms online, teachers must develop a toolkit of approaches to foster feelings of belonging even at a distance.
Get creative with technology, but remember to be authentic and stay consistent with your activities and practices. For example, morning meetings can be held virtually and video newsletters can bring communication with students and families to life. For more details about how to help students feel a sense of belonging online, check out these eight strategies.
Building Adult Capacity to Support Student Belonging
A culture of belonging starts with adults. All the adults in a building or district can work together to foster a school environment of caring, connection, and belonging. (Tweet this )
Here are three protocols that you can use in staff meetings (or as meeting warm-ups!) to develop adult capacity, skills, and mindsets around creating a culture of belonging in your school or district:
- Permission to Envision
- Mindsets for Adults
- Belonging Baton Pass
1. Permission to Envision
This activity for educators is an opportunity to give yourself permission to take a step back and envision what you hope to be true for your educational community.
Write a future headline that reflects your goals for student belonging. Once you know the headline, ask what needs to be done to realize those goals in your classroom, school, or district.
You can share your headline with team members or families, and use the headline as an aspiration for your classroom, school, or district.
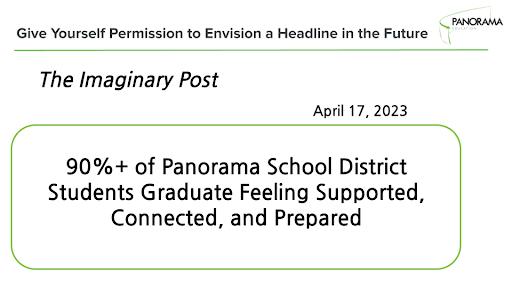 Example of a Permission to Envision headline
2. Mindsets for Adults
Identify shared decision-making tenets that are important to your community when it comes to building a culture of belonging. Example tenets could be acting with authenticity or utilizing asset-based approaches.
Once your school or district community has identified these core mindsets for adults, you can place these tenets at the top of meeting agendas so that whenever you make decisions that impact students, these tenets are top of mind.
3. Belonging Baton Pass
Cultivating a true sense of belonging is akin to a baton pass. As each adult learns what works for students, their hobbies, and how they like to feel seen, they can share that with other adults who are supporting those students.
Create simple, shareable information systems to capture belonging expertise amongst caring adults (classroom teachers, administrators, support staff, custodial staff, etc.) in your school community. Possible tools to use for this include Padlet, a Google Doc or spreadsheet, or Support Notes in the Panorama platform.
How Can You Measure Student Sense of Belonging?
What’s the best way to understand whether a student feels they belong at school? What’s the best way to assess the impact of belonging-building activities or strategies?
The answer to both is: Ask the students! Asking students (as well as faculty and staff) to reflect on their sense of belonging can give you the feedback you need to understand what is or isn’t working. (Tweet this)
The research-backed Panorama Social-Emotional Learning Survey includes an opportunity for students to reflect on their sense of belonging, so that schools and districts can measure the effectiveness of climate and culture programs.
Our survey questions are designed to help you understand how much students feel that they are valued members of the school community. Here are some examples:
- How well do people at your school understand you as a person?
- How much respect do students in your school show you?
- Overall, how much do you feel like you belong at your school?
Panorama’s Adult SEL survey also offers questions designed to assess adult sense of belonging, such as:
- How well do your colleagues at school understand you as a person?
- How much respect do colleagues in your school show you?
- Overall, how much do you feel like you belong at your school?
You can read and download the complete set of Panorama Student Sense of Belonging survey questions.
Success Story: Measuring Student Sense of Belonging with Panorama
D.C. Public Schools’ Anacostia High is using the Panorama SEL Survey along with the Panorama MTSS platform to measure and improve student sense of belonging.
Dr. William Blake, Assistant Director of Redesign at the school, shared the story of how they implemented a ninth grade Dream Team pilot program pairing every student with a caring adult in the building for daily check-ins.
Due to the pilot program, student sense of belonging increased by 11% from the Spring to Fall of 2021 in their Panorama survey results. Belonging translated to better academic outcomes—their highest rate yet of promotion from ninth to 10th grade.
 As Dr. Blake said, “The Dream Team pilot created an environment where every student believes they have somebody in the building who cares about their success. Now, our students feel more connected than ever before.”
Getting Intentional About Student Belonging
Has anyone ever told you to cheer up? Being told how to feel rarely has the intended effect. Telling students “You belong!” is just as ineffective.
When learning how to write in school, we’re told that we need to show, not tell, in order to make a convincing case. The same concept applies here. Students need adults to show them that they care for them and value them.
All of the tools, approaches, and practices shared in this article are suggestions for getting intentional about fostering student sense of belonging—and doing it in a way that authentically expresses that students are valued.
We already know you care deeply about those students. Now they need to know it too.
|
Frequently Asked Questions: 1. Why is student sense of belonging important in schools? Student sense of belonging is crucial because it directly impacts their well-being and academic engagement. When students feel valued and connected to their school community, they are more likely to be emotionally and academically invested in their education. 2. How can schools cultivate a sense of belonging for all students? Schools can cultivate a sense of belonging by implementing inclusive practices and creating a supportive environment where every student feels respected, understood, and valued. This can include fostering positive teacher-student relationships, encouraging different viewpoints, and providing opportunities for student voice and leadership. 3. What are some effective strategies for building student belonging in the classroom? Effective strategies for building student belonging in the classroom include greeting students at the door with a smile, implementing activities that allow students to share their interests and values, and incorporating morning meetings or check-ins to foster connection and community. 4. How can schools measure student sense of belonging? Schools can measure student sense of belonging through surveys or assessments that specifically inquire about students' perceptions of their school community, relationships with peers and adults, and feelings of inclusion and acceptance. 5. What role do adults play in supporting student belonging? Adults play a critical role in supporting student belonging by modeling inclusive behavior, building positive relationships with students, and creating a safe and welcoming environment where students feel seen, heard, and valued. |



.webp?width=478&height=557&name=panorama_student_survey-1%20(1).webp)